

Will DC region see above or below average snowfall this El Niño winter? Here’s what we know
DMV Winter 2023-2024 Outlook: Why we're expecting more snow, chance for blizzards in DC this winter
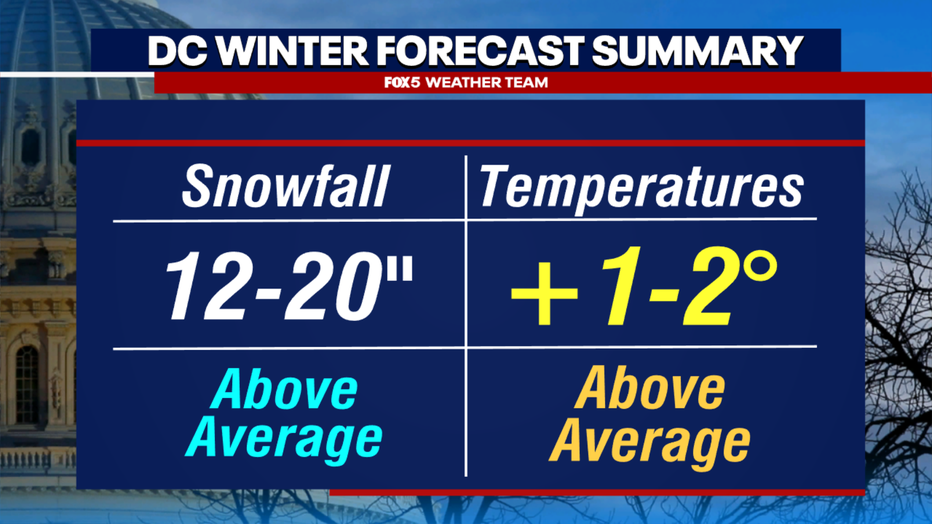
With a potentially strong El Niño in play for the 2023-2024 winter season, we're forecasting more snow than an average winter for the Washington D.C. metro, Northern Virginia and Maryland.
WASHINGTON - Nearly a month ago, we released our Fox 5 Winter Weather Outlook where we called for above normal snowfall this winter, as well as above normal temperatures. We also described the winter as a "feast or famine winter"…meaning that we believe that most of the snow will come from a couple of storms, and that if they fail to materialize, the winter could easily bust.
READ MORE: DMV Winter 2023-2024 Outlook
So what do we know so far? Well, as of the writing of this email, according to the "Oceanic Niño Index", we are officially in a moderate El Niño, though teetering on the verge of a strong El Niño fall leading into winter. This will be our first El Niño winter since the winter of 2015-2016, though this El Niño is so far not as intense as that year, which is currently one of the strongest El Niño events in recorded history.
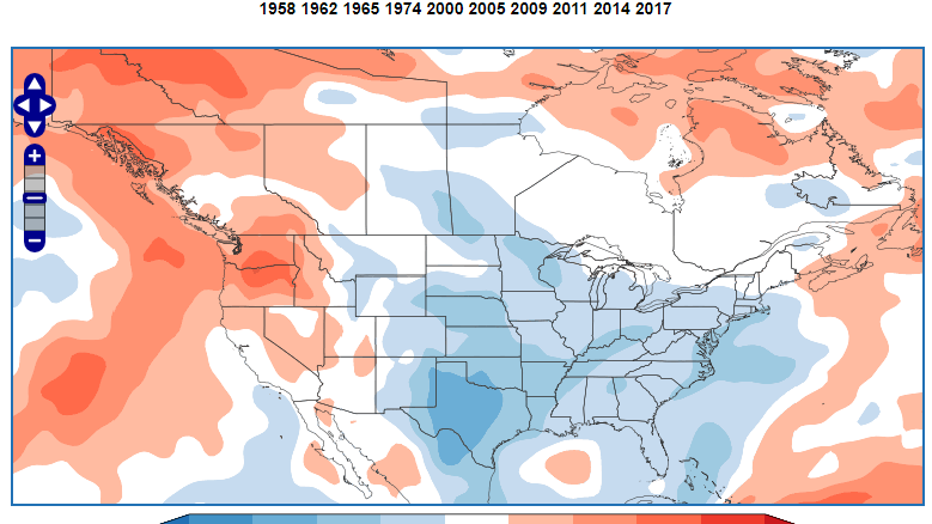
As the chart shows above, moderate to strong El Niño events are responsible for some of the snowiest winters in DC region, including the snowiest winter in our city’s history, 2009-2010 which featured three blizzards and 56.1" of snow. It was an incredible winter for snow lovers.
Unfortunately, it is not that easy to say "El Niño always brings big-time snow" as they are also responsible for the least snowy winters in DC history….which occurred twice. While the city has still never had a snowless winter in its recorded history, back to 1871, two winters (1972-73 & 1997-1998) were about as close as you can get without hitting zero with just 0.1" of snow. So what are some of the features we look for to determine if this El Niño is a snow-maker? Or a snow-duster?
Mixed Signals: El Niño Itself
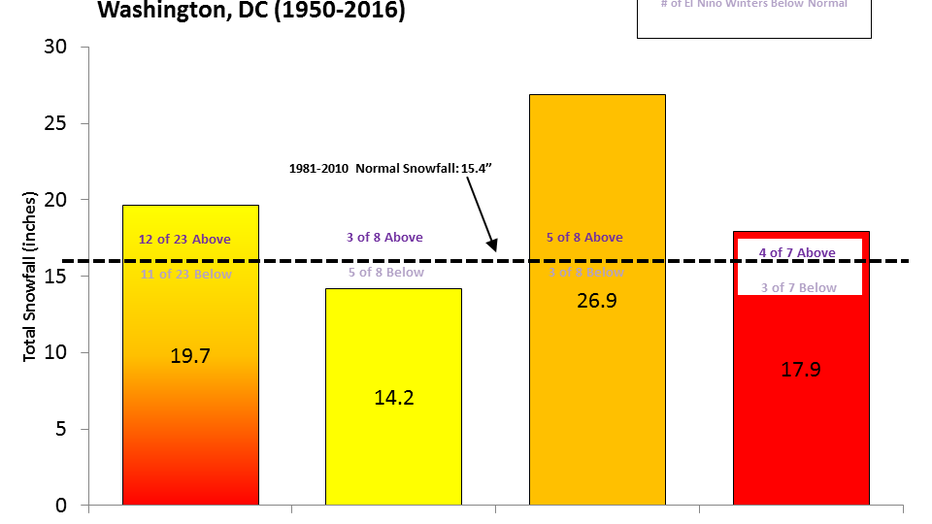
Washington, DC averages over a foot of snow every year, which is a number that can give snow lovers a false sense of security. In fact, in the last seventeen winters, DC has only surpassed a foot of snow six times. Four of these six years were El Niño winters. And of course, the vast majority of these came with storms that snow lovers enjoy more than any other…blizzards.
So what is a blizzard? Officially, the National Weather Service defines a blizzard as a storm which contains large amounts of snow OR blowing snow, with winds in excess of 35 mph and visibilities of less than quarter mile for at least three or more hours. The last official blizzard to hit Washington, DC was in January of 2016, nearly eight years ago. And there is lies the difficulty with basing a winter forecast solely off the expectation of a blizzard or two…they are rare.
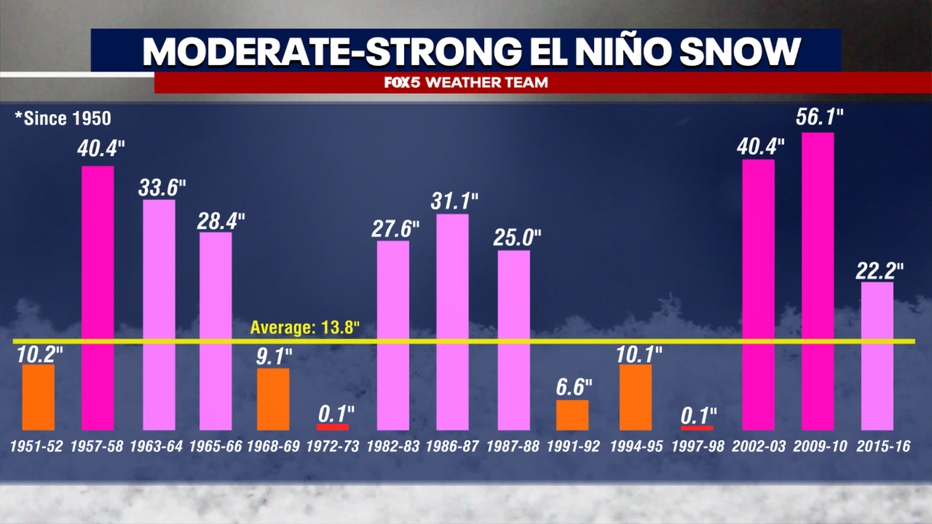
Examine the chart above again. Of the fifteen cases of moderate to strong El Niño events we have on record, nine of them featured well above normal snowfall. And while the totals may be different in their extremes, there is a number that nearly all of these years share in common. That number is two. In eight of the nine snowfall years, most of the snow came from just two snowfall events, with only 2009-10 being the year with more (5 events of over 6" of snow). This is what can make an El Niño year a feast or famine setup, as a near miss from a big storm could cut the potential season total in half.
So what makes an El Niño year a "feast" year as opposed to a "famine" year. While there are not guarantees ever when it comes to seasonal forecasting, there are some climate signals that can give us hints. The chart above shows the state of El Niño in November in years that have been big snow makers for the DC region. When examining the state of El Niño, forecasters generally look at two regions, an area in the central Pacific known as Niño 3+4, and another area off the western coast of South America, known as Niño 1+2.
When the strength of the El Niño is what we call "center based", that is to say that warm water anomalies in the central Pacific outweigh those farther to the east, research has shown this to be a more favorable setup to the patterns necessary to promote a storm track in the eastern part of the United States. The El Niño of 2009-2010 was a classic case of this, and was well forecast to be a very snowy winter.
By contrast, when we examine the El Niño years that have under-performed here in the DC area, the area that tends to show more abnormal warmth is the Niño 1+2 region. When this area shows strong warmth, historically it is not so much that winters have struggled with snow, so much as winters have struggled to stay cold, which results in more limited chances to get into some of the bigger storms to cooperate in terms of them being snow as opposed to rain.
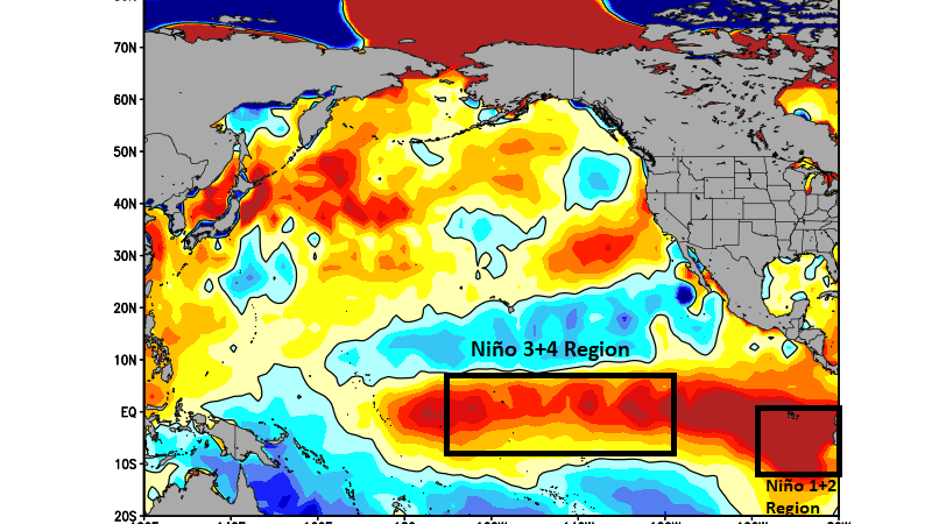
When we look at where we stand through the middle of November, the clear winner to this point in the season in Niño 1+2. It has been tracking as one of the warmest on record, with weekly numbers close to those observed in the El Niño of 1997 and 1983 during the summer months, those it has faded to numbers similar to November of 2015 at this stage. Perhaps the key for winter will be the fade, as if the waters in this region continue to cool through the duration of winter, it will make the potential for colder air and a bigger storm more likely for the second half of the winter.
As for the key Niño 3+4 region, waters in this region are tracking close to numbers that will make snow lovers salivate. In fact, five of the top six analog years produced over 20" of snow in Washington, DC. The problem though, the top analog as of this writing is 1997-1998, which featured just 0.1" of snow. The key to the winter ahead will likely come if waters in the Niño 3+4 region can hold onto their warmth, while Niño 1+2 waters continue to cool through the winter. Should this happen (as some models predict) it could be a blockbuster of a snow season once 2024 begins. For now, we will say that it is sending us mixed signals as to whether or not it is leaning in a snowier direction or not.
Argument For Less Snow: The Pacific Decadal Oscillation
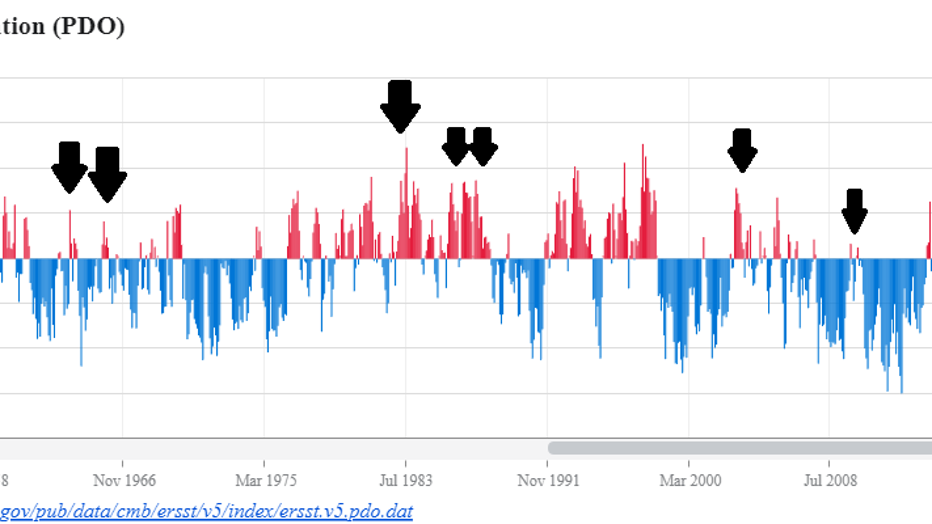
While El Niño often steals the headlines and is perhaps the strongest indicator we have to whether or not a winter season will be stormy or dry, its cousin to the north, the Pacific Decadal Oscillation (PDO for short), can absolutely give us hints to what the winter could hold as well. The PDO has to do with the spread of warm and cold waters in the North Pacific, and how they influence the weather pattern across specifically Alaska and the western United States. On the chart above, I have marked the time of the nine snowiest moderate-strong El Niño events since 1950. Just about all of the occurred when there was a weakening in a negative PDO pattern, or the PDO pattern was in a positive regime. Though October, we remain in a strongly negative PDO regime. In these types of El Niño years, when the PDO is also negative, DC has averaged 11.58" of snow. By comparison, when it is positive, DC averages over 28" of snow. If the PDO remains negative throughout the winter, and we fail to pick up above normal snowfall, it is certainly something that we will need to go back to as a potential reason why.
Argument For More Snow: The Quasi-Biennial Oscillation
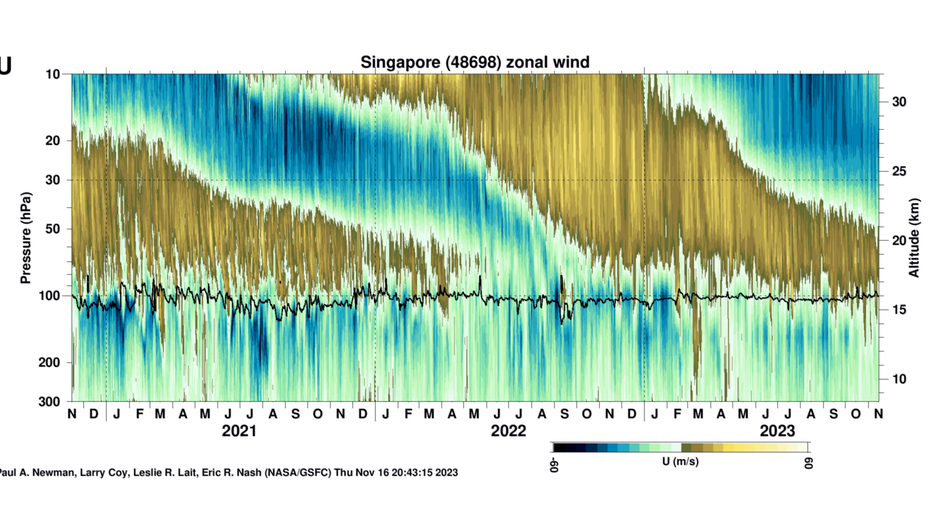
Likely something you have never heard of before, the Quasi-Biennial Oscillation (QBO) is a regular variation of the winds that blow high above the equator. Strong winds in the stratosphere travel in a belt around the planet, and every fourteens months or so, these winds completely change direction. The QBO is in its positive phase when these upper level winds are westerly, and negative when these upper level winds are easterly. As the chart above shows, the QBO is currently diving southward towards its negative phase, just in time for winter.
Winters where the QBO dived into the negative phase have had a tendency to feature colder than normal temperatures for winter time. Unfortunately for snow lovers, it has also been correlated to drier than normal condition during the winter as well. There is a notable anomaly though...
In the chart above, we are tracking upper level temperature anomalies on the top, while we are tracking QBO phases and strength on the bottom. You can see three notable spikes in the temperature chart, which coincide with three notable dips in the QBO. One of them is the setup for this coming winter. The other two times this has happened recently? 2015-16, which featured a blizzard, and 2009-10, which featured several blizzards. This correlation argues that would could very well indeed be in for a bigger snow season in the winter ahead, perhaps even one that exceeds our forecast expectations.
Winter officially begins on Thursday, December 21st. Until then, here are some fun dates and numbers to keep in mind here in DC...
-Average Date of First Measurable Snow in DC: December 12th.
-Average Date of First Inch Of Snow in DC: December 23rd.
-Average Dates of Most Impactful Snow Events (5"+): January 20th – February 7th.
-Average Date of Last Measurable Snow in DC: March 7th.